Why Did China–U.S. Ocean Freight Rates Rise for Eight Straight Weeks?
08/10/2026
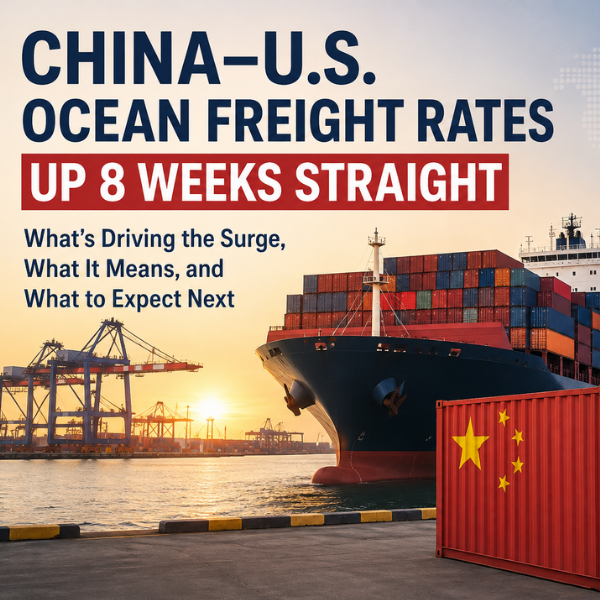
The rate increase was driven by several overlapping pressures. Tariff-related frontloading, inventory replenishment, fuel costs, route disruption, and controlled vessel capacity all contributed.
Demand rose faster than effective capacity. U.S. importers moved merchandise earlier than usual, while longer shipping routes and blank sailings limited available vessel space.
West Coast and East Coast rates behaved differently. East Coast services generally remained more expensive because of longer voyages, additional operating costs, and reduced effective capacity.
The rally showed signs of peaking in July. Weekly benchmark rates declined in the second half of the month, but they remained well above early-2026 levels.
Warehousing flexibility matters when ocean markets are volatile. Importers may need short-term storage, transloading, cross-docking, or overflow capacity when containers arrive earlier or in larger batches than originally planned.
China–U.S. ocean freight rates are the prices shippers pay to move containers from Chinese ports to destinations on the U.S. West Coast, East Coast, and Gulf Coast. By early July 2026, spot container rates had risen for roughly eight consecutive weeks as importers accelerated orders, vessel capacity tightened, and geopolitical risks increased shipping costs.
What happened to China–U.S. ocean freight rates?
Transpacific container shipping prices increased rapidly during May and June 2026. An early-July market report described container spot rates as having surged for eight weeks to a post-pandemic high; its later market assessment showed increases continuing across major trade lanes for as many as 10 consecutive weeks. Asia–U.S. West Coast rates had increased by more than 200% from earlier levels, while East Coast rates were up approximately 101%.
The increase was particularly visible in the cost of shipping a 40-foot container, commonly called a forty-foot equivalent unit, or FEU. By late June, the average China-to-U.S. West Coast rate had reached approximately $5,933 per FEU -about three times its late-February level and its highest point since September 2024.
The eight-week rally did not continue indefinitely. By the end of July, the market had begun to correct:
- Asia–U.S. West Coast rates fell 12% during the week ending July 29, reaching $6,212 per FEU.
- Asia–U.S. East Coast rates declined 1% to $9,002 per FEU.
- Another widely followed benchmark showed Shanghai-to-Los Angeles rates down 2% to $5,739 per 40-foot container, while Shanghai-to-New York remained unchanged at $7,578.
- The broader global container index fell for a third consecutive week by July 30.
The most accurate interpretation, therefore, is that China–U.S. ocean freight rates experienced an eight-to-10-week surge through early July 2026, followed by a gradual pullback in the second half of the month. Rates remained elevated even after the weekly increases ended.
Why did China-to-U.S. container shipping costs increase?
The rate surge was not caused by one isolated event. It resulted from a combination of stronger cargo demand and restrictions on effective shipping capacity.
Tariff uncertainty encouraged importers to ship early
Many U.S. businesses moved orders forward to reduce their exposure to potential tariff increases. This practice, known as frontloading, concentrates several months of normal shipping demand into a shorter period.
Retail and port forecasts projected June 2026 imports at 2.33 million TEUs, an 18.7% year-over-year increase. The first half of the year was expected to reach 12.77 million TEUs, approximately 2% higher than the same period in 2025.
A TEU is a twenty-foot equivalent unit. One 40-foot container typically equals two TEUs.
Actual port activity reflected this increase. The Port of Los Angeles handled more than 1 million TEUs in June 2026, its strongest June on record. Loaded imports reached 530,558 TEUs, up approximately 13% year over year, while total container volume rose 12.4%.
When importers compete for the same vessel departures, spot rates rise quickly, especially when carriers cannot add ships or container equipment at the same speed.
Retailers replenished inventories and advanced peak-season orders
Businesses were not only reacting to tariffs. Many were also replenishing inventories and bringing in holiday merchandise earlier than usual.
Retailers accelerated imports of apparel, electronics, decorations, and other seasonal products to avoid future tariffs and higher fuel surcharges. This brought traditional peak-season demand forward, increasing competition for container slots during May and June rather than later in the summer.
This early peak season can create a temporary mismatch: cargo demand surges immediately, while ships, terminal appointments, chassis, trucks, and warehouse space remain relatively fixed.
Route diversions reduced effective vessel capacity
Geopolitical instability continued to affect routes connecting Asia with Europe and North America. When ships avoid shorter passages and take longer routes, each vessel completes fewer annual voyages.
Industry estimates indicated that continued Red Sea diversions were effectively removing approximately 10% to 15% of global container capacity. The ships still existed, but longer voyages meant fewer containers could be moved within the same period.
Even though the China–U.S. West Coast route does not normally pass through the Red Sea, global shipping networks are interconnected. Vessels, containers, schedules, fuel, and port calls are allocated across multiple trades. Disruption in one region can therefore tighten capacity elsewhere.
Fuel and geopolitical risk increased operating costs
Higher fuel prices and war-risk conditions also contributed to rising container shipping costs. During the 2026 surge, importers faced the prospect of emergency fuel surcharges and higher operating expenses linked to instability in the Middle East.
Some fuel-related charges were scheduled to take effect in August, adding uncertainty even as base spot rates began to decline. This means a lower headline freight rate does not necessarily translate into an equivalent reduction in the final shipping invoice.
Blank sailings helped limit available space
A blank sailing occurs when a scheduled vessel departure or port call is canceled. Carriers use blank sailings to respond to operational disruption or reduce excess capacity when demand begins to weaken.
For the five-week period from August 3 through September 6, 58 of 723 scheduled sailings across major East–West routes were expected to be canceled. Approximately 60% of those cancellations were concentrated on the eastbound transpacific trade.
Blank sailings can support freight rates by reducing the number of available container slots. They can also create practical problems for shippers, including rolled bookings, longer lead times, and sudden changes to arrival schedules.
How should businesses interpret ocean freight rate benchmarks?
Ocean freight indexes do not always show the same rate because they use different data sources, route definitions, contract terms, and calculation methods.
The Shanghai Containerized Freight Index, for example, tracks spot-market export rates from Shanghai across 15 routes. It reports most routes in U.S. dollars per TEU, but U.S. West Coast and East Coast lanes are quoted per FEU. The index represents an average all-in price for general containerized cargo under its defined shipping terms.
Other benchmarks may measure broader China or East Asia origins, different destination ports, or different weekly booking periods. That is why one late-July index reported West Coast rates at $6,212 per FEU while another reported Shanghai-to-Los Angeles at $5,739. Both figures can be valid within their respective methodologies.
Importers should compare quotes using consistent assumptions:
- Origin and destination ports
- Container size and equipment type
- Base ocean rate
- Peak-season and fuel surcharges
- Origin and destination handling charges
- Free time for detention and demurrage
- Drayage, transloading, storage, and final delivery
- Guaranteed versus non-guaranteed vessel space
The lowest base rate is not always the lowest total landed logistics cost. A cheaper sailing can become more expensive if it involves delays, limited free time, congestion, container storage charges, or an urgent final-mile move.
How can importers manage the impact of higher freight rates?
Businesses cannot control market rates, but they can reduce exposure to sudden increases and operational disruptions.
First, importers should avoid treating one weekly rate as a long-term forecast. The 2026 market moved from a multiweek surge to three consecutive weekly declines within the same quarter. Freight budgets should therefore include a reasonable range rather than a single fixed spot-rate assumption.
Second, shippers can separate high-priority inventory from less time-sensitive cargo. Critical products may justify premium vessel space, while lower-priority goods can be booked on flexible services or held at origin until the market becomes more favorable.
Third, businesses should plan destination capacity before the container departs. Early arrivals and frontloaded imports can overwhelm permanent distribution centers, even when port operations remain fluid. Arranging overflow warehousing, transloading, cross-docking, and drayage in advance can reduce the risk of detention, demurrage, rejected deliveries, and emergency storage costs.
Finally, importers should monitor both demand and capacity indicators. Port import volumes, blank sailings, spot-rate indexes, fuel surcharges, and tariff implementation dates can provide earlier warning than a freight quote alone.
How can OLIMP support importers during ocean freight volatility?
OLIMP Warehousing connects businesses with flexible warehousing and logistics services across the United States and Canada. Its North American network includes more than 5,000 warehouse locations and supports services such as short-term and long-term storage, transloading, drayage, cross-docking, pallet rework, fulfillment, and yard storage. Businesses can arrange capacity without a long-term contract, including options for as little as one pallet for one day. This flexibility can help importers manage frontloaded inventory, unexpected container arrivals, distribution-center overflow, and port-to-warehouse transfers when China–U.S. ocean freight conditions change quickly.
Importers reviewing upcoming China–U.S. shipments should evaluate ocean rates together with arrival timing, warehouse capacity, drayage availability, and total landed cost, not freight price alone.
Frequently Asked Questions (FAQ) – OLIMP Warehousing
Q: Why did China–U.S. ocean freight rates rise for eight straight weeks?
Rates increased because importers frontloaded cargo ahead of potential tariffs, retailers replenished inventory, effective vessel capacity tightened, and fuel and geopolitical risks raised operating costs.
Q: Are China-to-U.S. freight rates still rising?
Not continuously. By July 30, 2026, major benchmarks had declined for three consecutive weeks. West Coast rates fell more sharply than East Coast rates, although prices remained elevated compared with earlier in the year.
Q: How much does it cost to ship a 40-foot container from China to the United States?
In late July 2026, major indexes placed Asia-to-U.S. West Coast rates between approximately $5,700 and $6,200 per FEU. East Coast rates were approximately $7,600 to $9,000, depending on the benchmark, port pair, and included charges.
Q: Why is shipping from China to the U.S. East Coast more expensive?
East Coast routes generally involve longer transit distances and higher vessel operating costs. Routing choices, port congestion, fuel consumption, canal or alternative-route conditions, and available capacity can widen the difference.
Q: What is the difference between a TEU and an FEU?
A TEU represents one 20-foot container. An FEU represents one 40-foot container and is generally equal to two TEUs. U.S.-bound spot rates are commonly quoted per FEU.
Q: What is a blank sailing?
A blank sailing is a canceled scheduled vessel departure or port call. It reduces available capacity and may cause bookings to be moved to later ships. Transpacific routes accounted for most planned East–West blank sailings entering August 2026.
Q: Will China–U.S. ocean freight rates fall further?
Further declines are possible if frontloading slows and import demand weakens. However, blank sailings, fuel surcharges, tariffs, port congestion, and geopolitical disruption could limit the decline or create another short-term increase. Current market data supports expecting continued volatility rather than a smooth, predictable return to earlier rates.
You may be interested in
Importing From China to the U.S. Is a Compliance Minefield: How Top Importers Avoid Delays and Build a Smarter Warehousing Strategy
Importing from China can look simple-book freight, pay duties, deliver to a warehouse-until a missing compliance detail turns “arrival day” into a weeks-long hold. In the U.S., import clearance is a multi-agency process where documentation accuracy and warehouse readiness directly affect speed, cost, and cash flow.Why Importing From China Is a Compliance Minefield in the […]

Planning for Chinese New Year 2026: How U.S. Importers Can Navigate Major Logistics Disruptions
Chinese New Year (Lunar New Year or Spring Festival) 2026 begins on February 17 (the Year of the Horse). This holiday is Asia’s biggest annual manufacturing shutdown, with official holidays likely Feb 17–23. In practice, factories begin closing weeks early and resume slowly, so the supply chain impact often stretches roughly mid-January through early March. […]
Amazon FBA vs 3PL: 2026 U.S. Cost Comparison and Guide
A 3PL (third-party logistics) provider is a company you outsource warehousing and fulfillment to, typically covering storage, pick/pack, shipping, and often returns. Fulfillment by Amazon (FBA) is a program where you send inventory into Amazon’s network and Amazon stores it, then picks, packs, ships, and handles customer service and returns, while also enabling fast Prime […]
Ready to streamline your warehousing needs?
Request a quote today and discover how OLIMP's tailored solutions can optimize your operations